Get a Quick Payback with KX7
Make a smart investment with KX7 concaves that deliver a fast return on investment. Combine this with our improved grain/sample quality and increased capacity that maximize your return at the elevator and minimize your time in the cab!
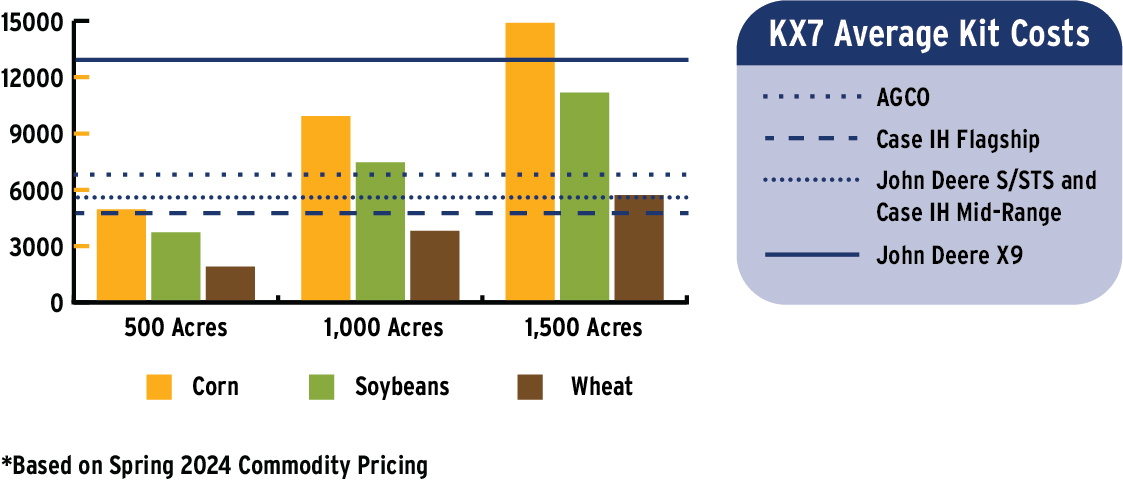
The below chart is generated using the table data below for rotor loss savings alone.
Dependent on your make and model combine and crops harvested, you may see a return on investment in as few as 500 acres!

Let's look at the numbers.
The average rotor loss for traditional concaves is (at best) 1.5%.
The average rotor loss for KX7 concaves is 0.25%.
Using commodity prices (source: https://www.agweb.com/markets/futures) and yield averages to multiply the dollars attributed to rotor loss, the lowered losses with KX7 quickly adds up to more dollars in your pocket, and for most users, it pays for itself in the first year.
Table 1: Projected Payouts with Calculated Rotor Loss
| A | B | C | D | E | F | G | H | I |
| Crop | Futures $ | Nat'l Avg Yield Bu/Ac |
Traditional Concaves | KX7 Concaves | ||||
| Rotor Loss Bu/Ac |
Rotor Loss $/Ac |
Total Payout/Ac |
Rotor Loss Bu/Ac |
Rotor Loss $/Ac |
Total Payout/Ac |
|||
| Corn | $4.48 | 177.3 | 2.6595 | $11.91 | $782.39 | 0.443 | $1.99 | $792.32 |
| Soybeans | $11.79 | 50.6 | 0.759 | $8.95 | $587.63 | 0.127 | $1.49 | $595.08 |
| Wheat | $6.27 | 48.6 | 0.729 | $4.57 | $300.15 | 0.1215 | $0.76 | $303.96 |
| Futures Price Close Date: 6/9/24 | ↑ | ↑ | ↑ | ↑ | ↑ | ↑ | ||
| =1.5%* C | =B*D | =(B*C)-E | =0.25%*C | =B*G | =(B*C)-H | |||
Table 2: KX7 ROI by Acre
| A | B | C | D | E | F | G | H | I | J |
| Crop | 500 Acres | 1000 Acres | 1500 Acres | ||||||
| Traditional Payout |
KX7 Payout |
ROI | Traditional Payout |
KX7 Payout |
ROI | Traditional Payout |
KX7 Payout |
ROI | |
| Corn | $391,195 | $396,159 | $4,964 | $782,389 | $792,318 | $9,929 | $1,173,584 | $1,188,477 | $14,893 |
| Soybeans | $293,813 | $297,541 | $3,728 | $587,625 | $595,083 | $7,458 | $881,438 | $892,624 | $11,186 |
| Wheat | $150,076 | $151,980 | $1,904 | $300,151 | $303,960 | $3,809 | $450,227 | $455,940 | $5,713 |
| ↑ | ↑ | ↑ | ↑ | ↑ | ↑ | ↑ | ↑ | ↑ | |
| =500* Table 1(F) |
=500* Table 1(I) |
=C-B | =1000* Table 1(F) |
=1000* Table 1(I) |
=F-E | =1500* Table 1(F) |
=1500* Table 1(I) |
=I-H | |
The ROI numbers above are represented in the colored bar chart on the screen above.


